BoardStudy given Class 11 Math Chapter 13 Statistics notes according to latest NCERT syllabus to make your study more convenient and easy. We have covered every topic in a simple and easy way so anyone can understand the chapter and perform well in the exam.
Notes are very clean and colourful written by BoardStudy subject matter experts. Every important concept, formula, diagram and derivation is shared in the Statistics notes that will help you solve the problem. By reviewing these notes regularly you will master the Statistics chapter and can score well in exam.
Class 11 Math Chapter Statistics Notes
Chapter 12: Limits and Derivatives
Chapter 14: Probability Notes
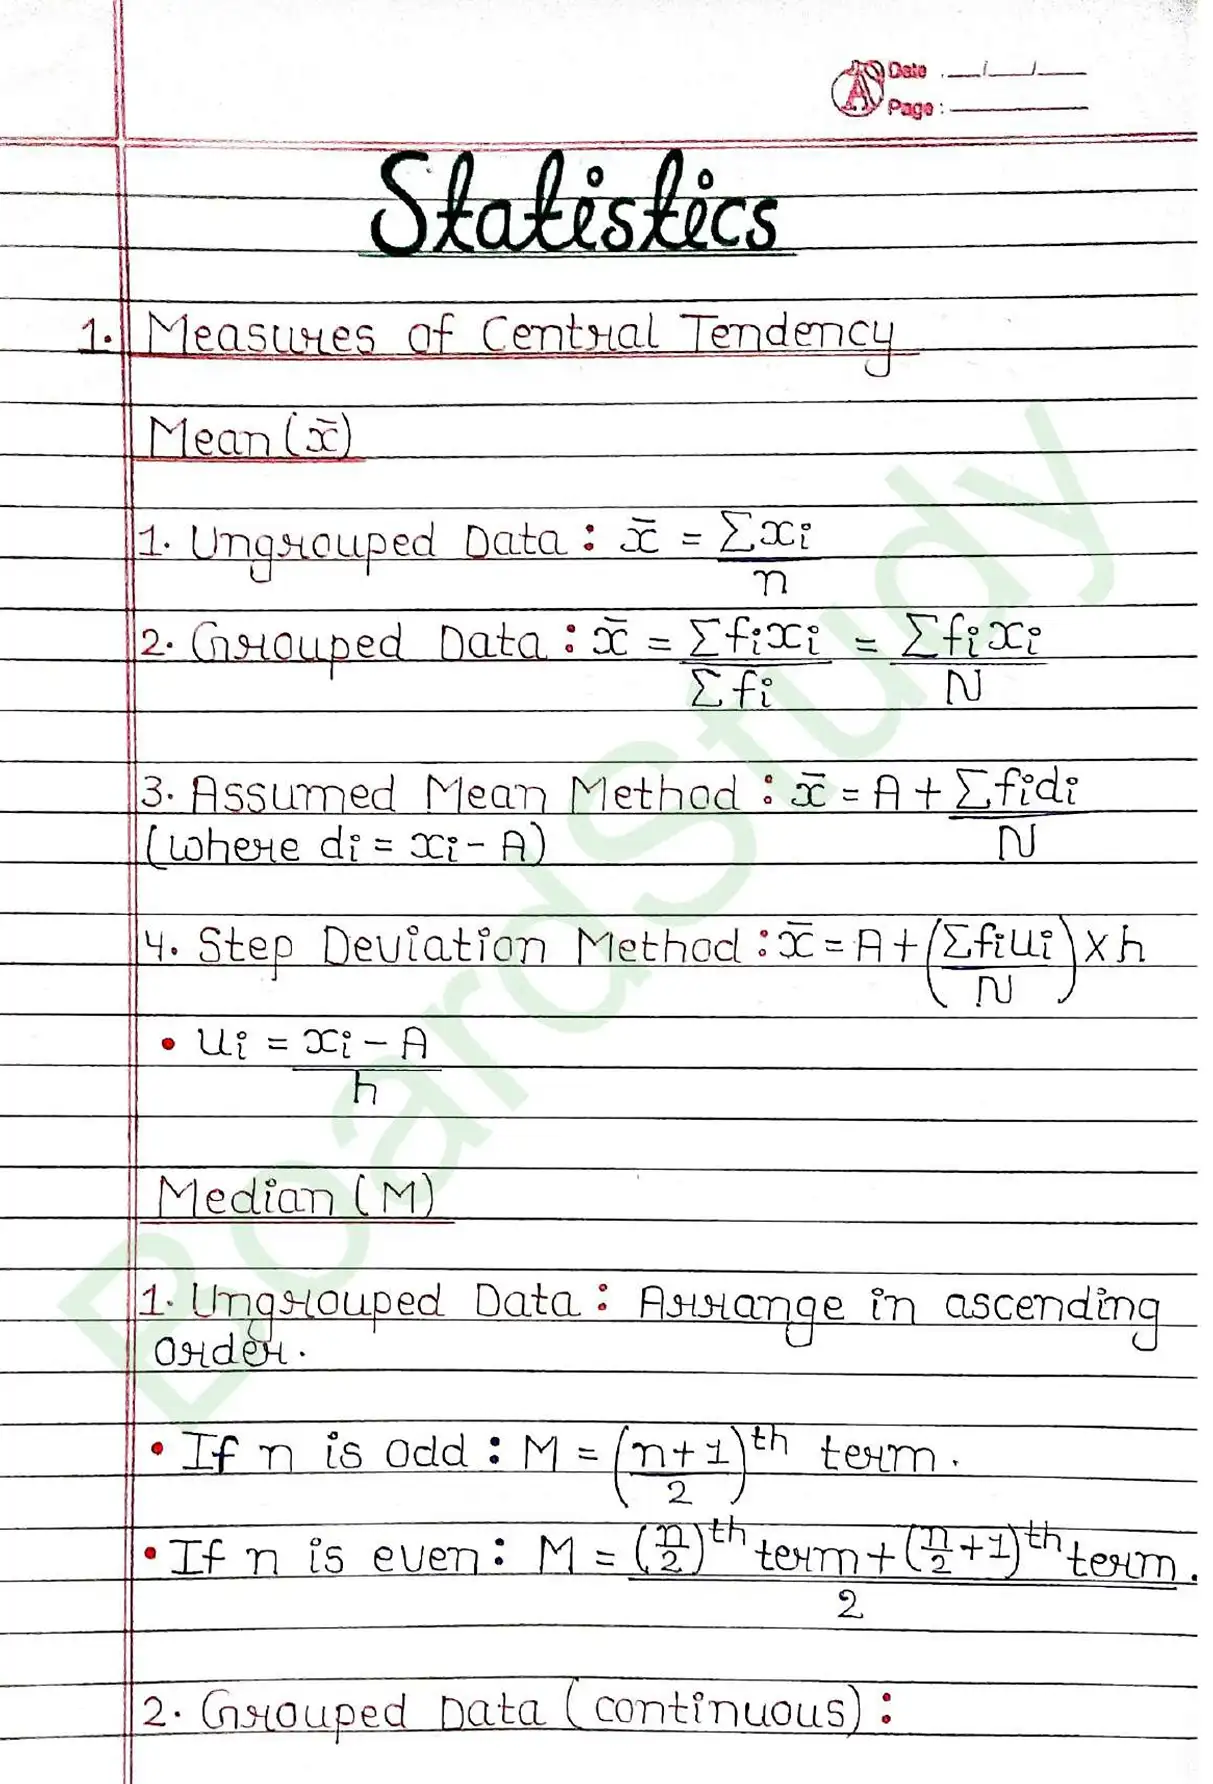
Key Points Statistics
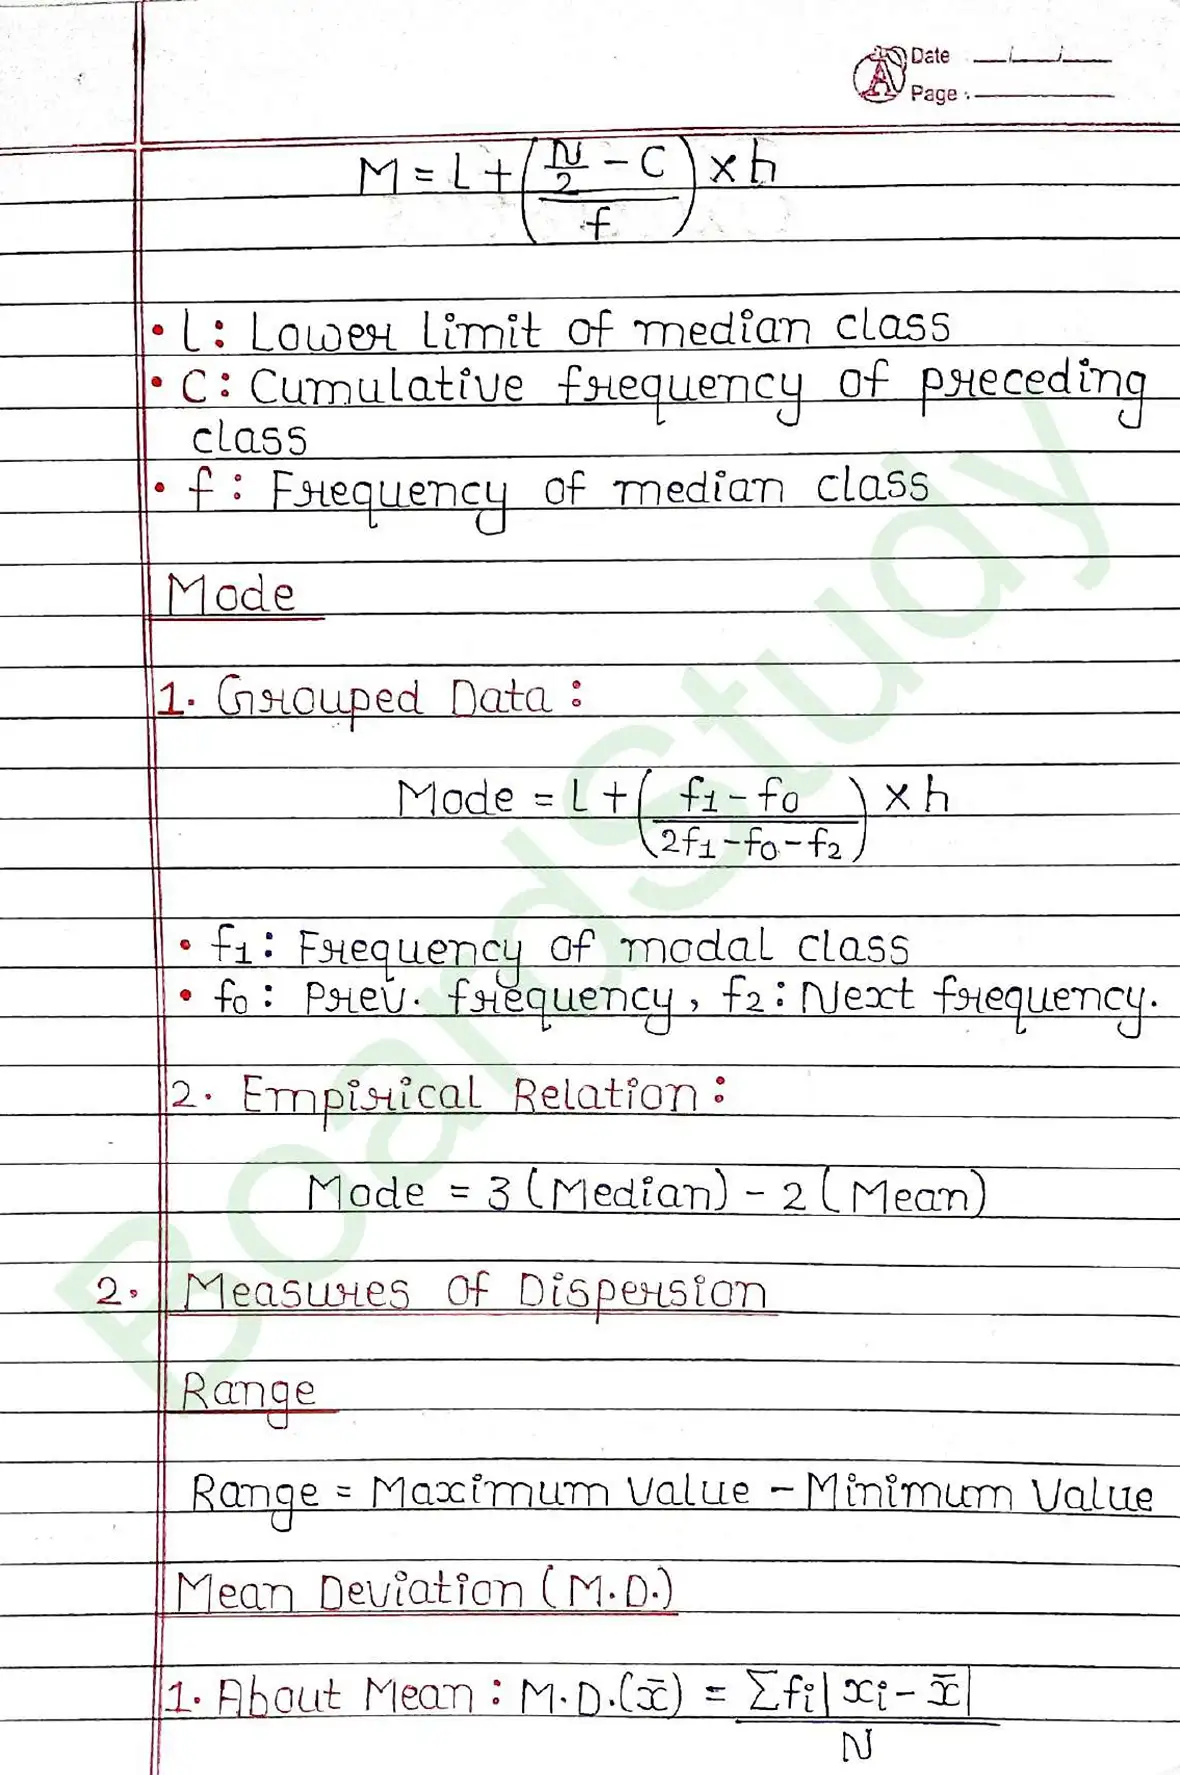
Measure of Dispersion
The dispersion is the measure of variations in the values of the variable. It measures the degree of scatteredness of the observation in a distribution around the central value.
It is measured on the basis of observations and the types of measure of central tendency used there. There are following measures of dispersion:
(i) Range
(ii) Quartile deviation
(iii) Mean deviation
(iv) Standard deviation
Range
Range – It is the difference between two extreme observations of the distribution.
Shortcut method for calculating median
where,
→ lower class boundary of the median class
h → size of the median class interval
→ frequency corresponding to median class
→ total number of observations i.e. sum of the frequencies
→ cumulative frequency preceding median class
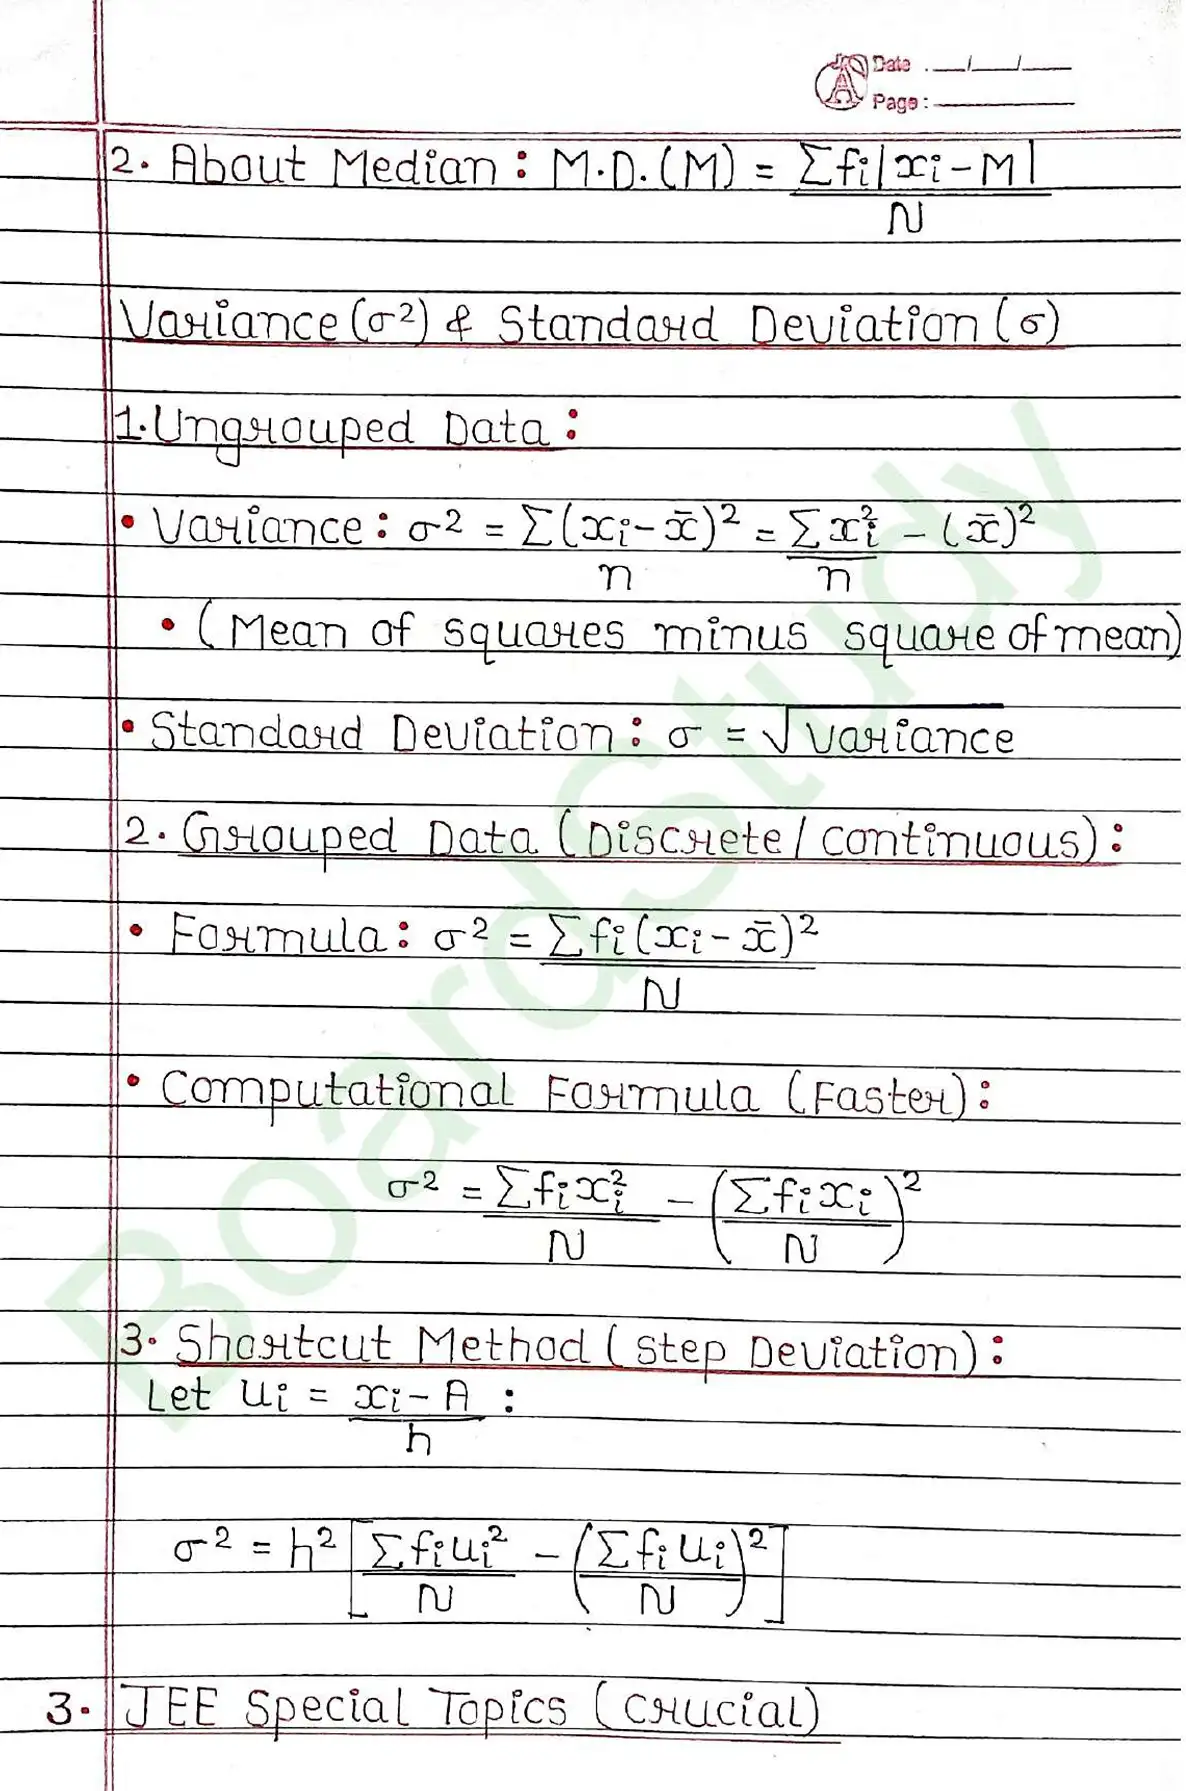
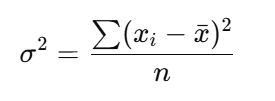
Variance
Variance is the arithmetic mean of the square of the deviation about mean .
Let be n observations with as the mean, then the variance denoted by , is given by
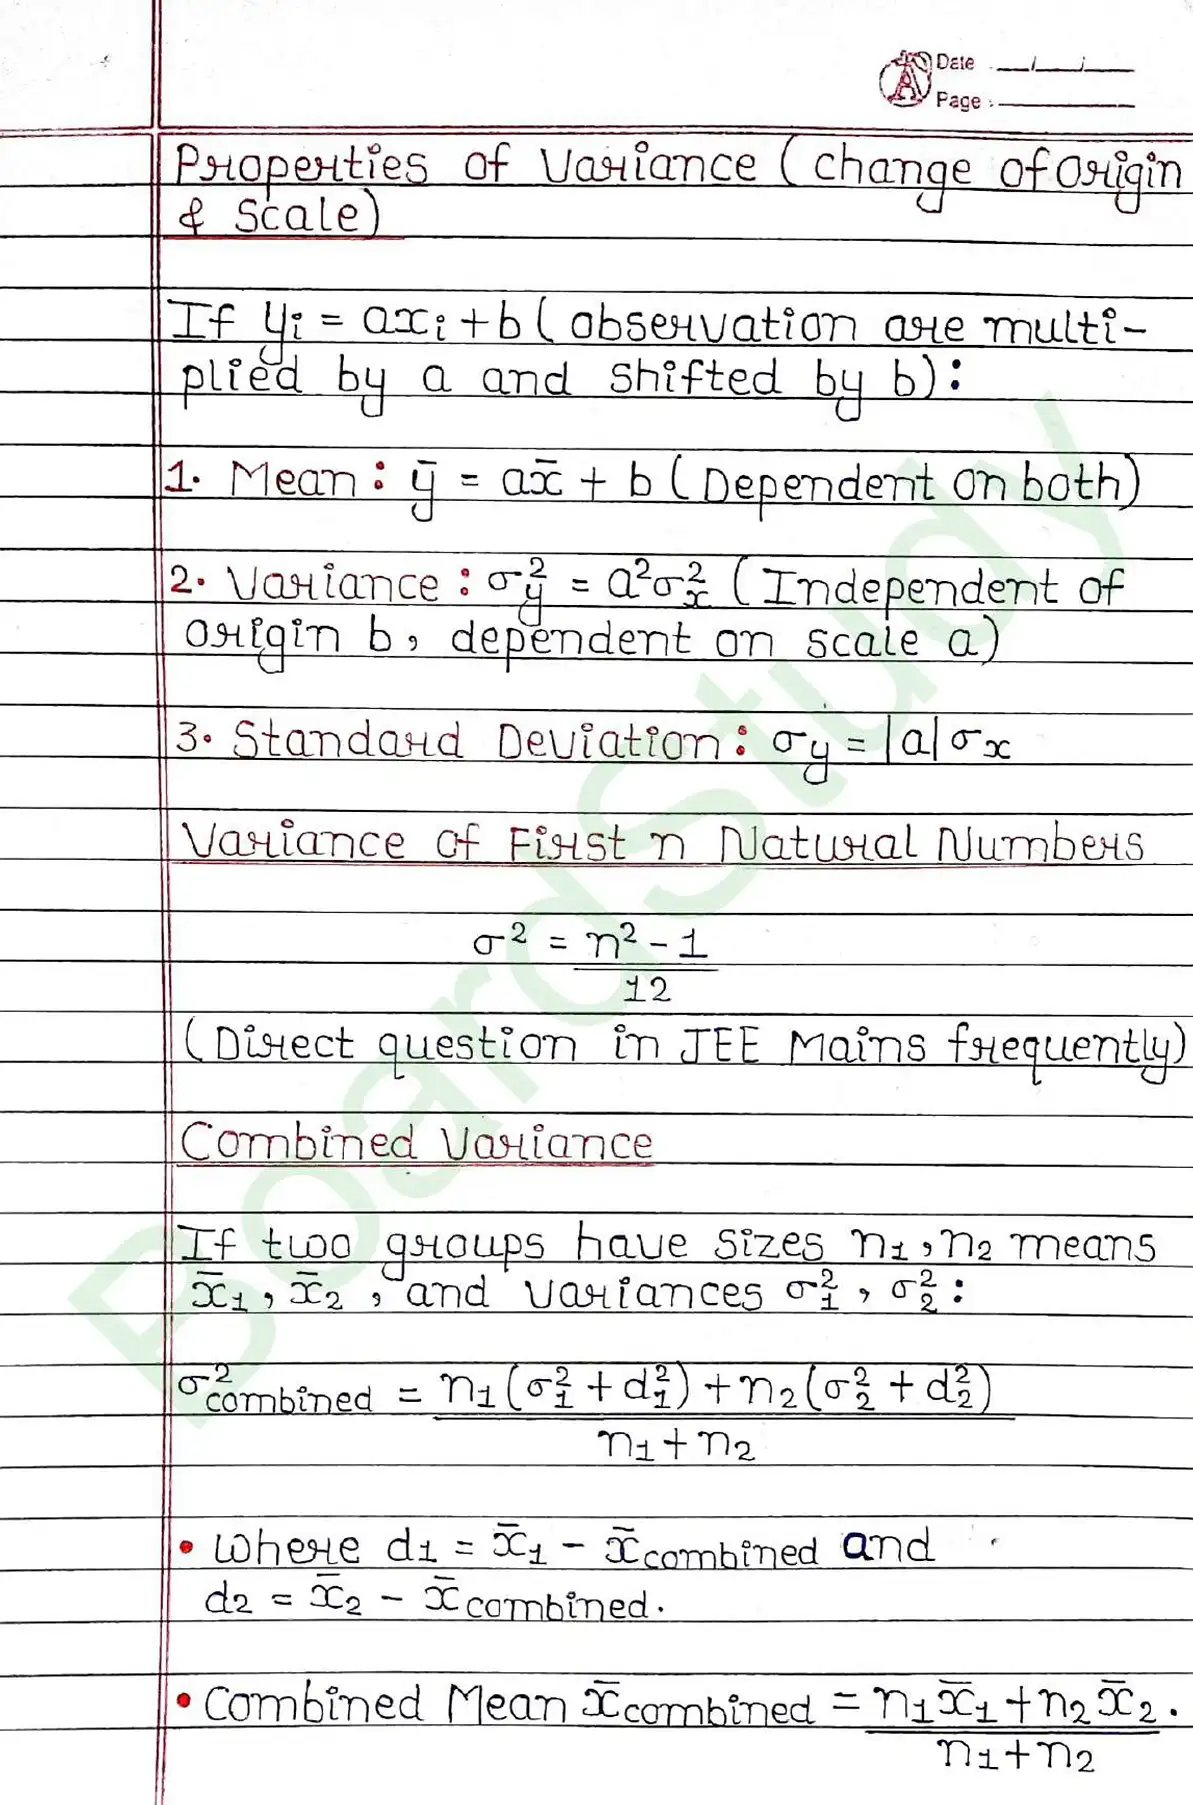
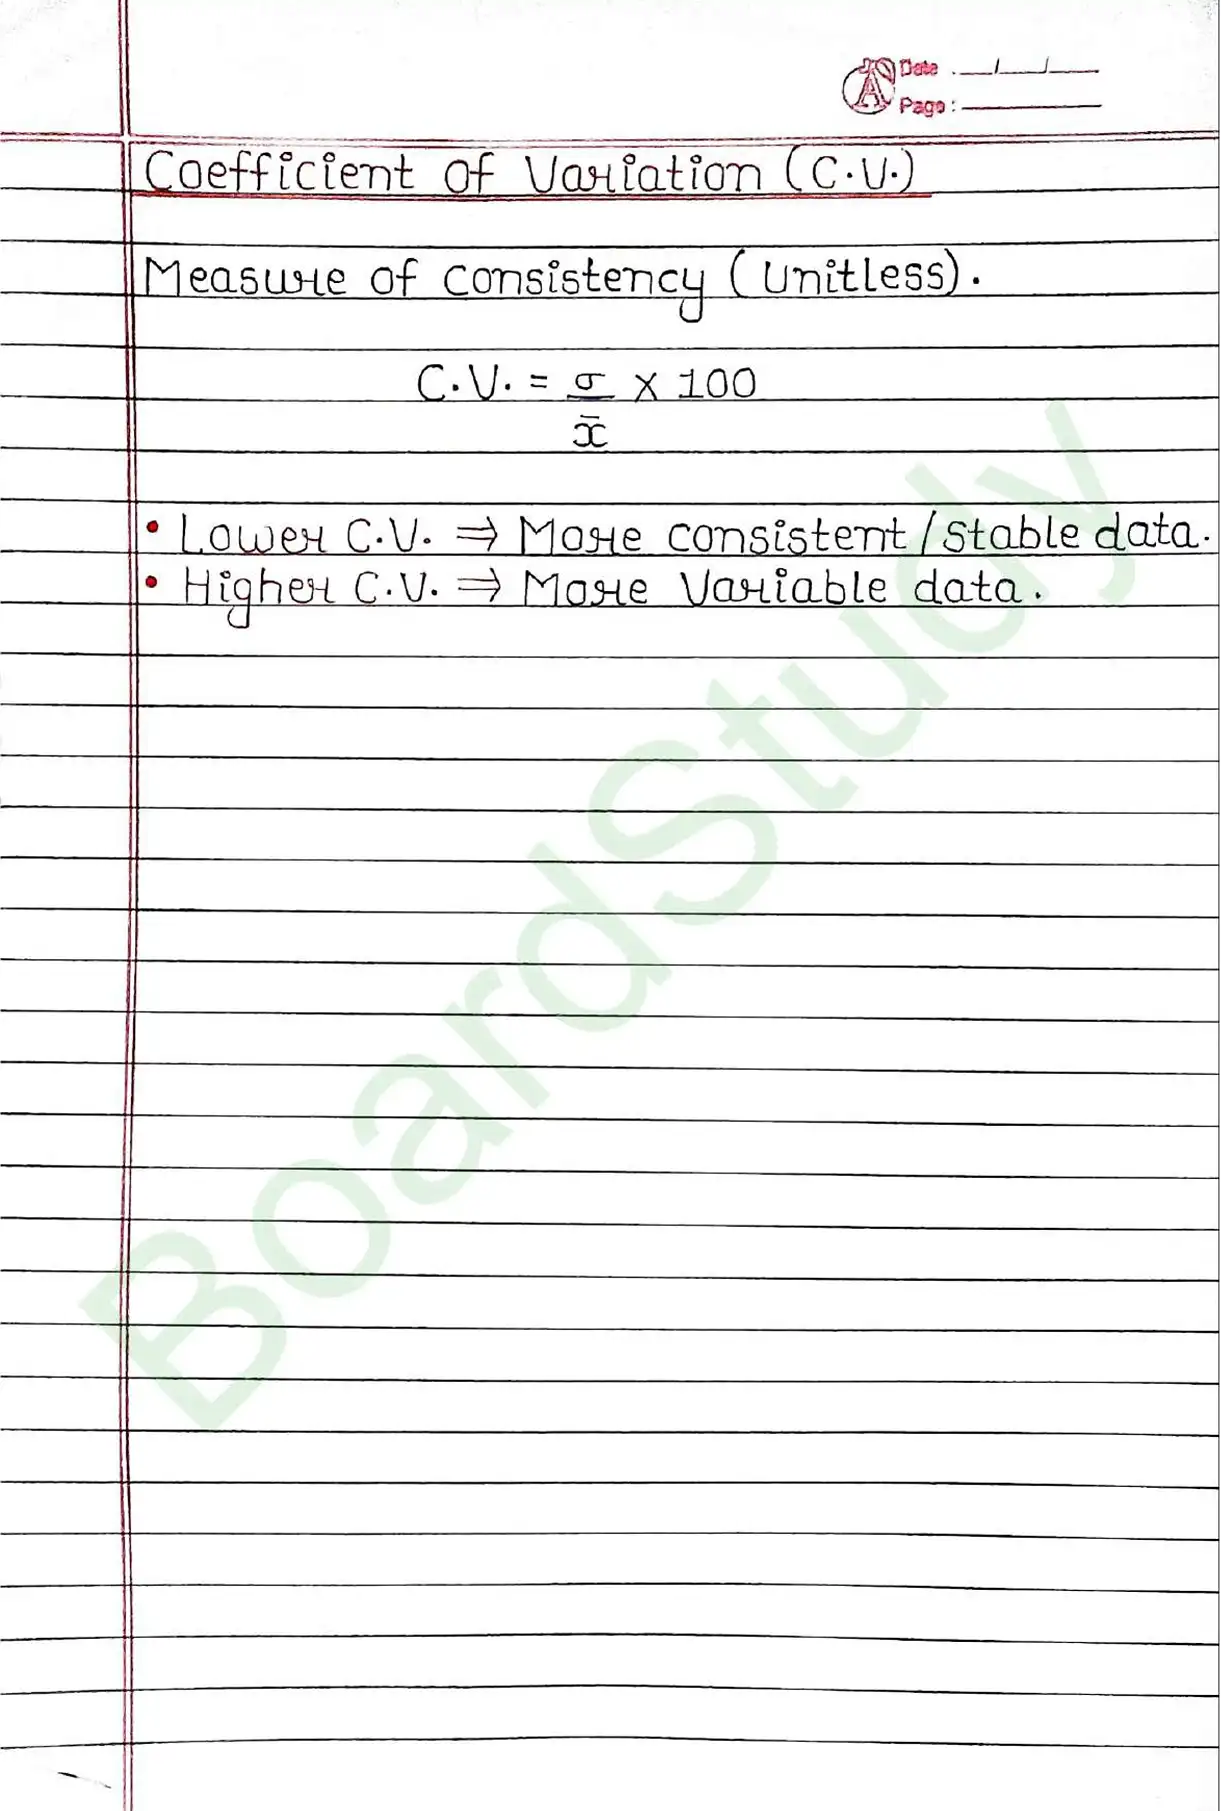
Coefficient of variation
In order to compare two or more frequency distributions, we compare their coefficient of variations. The coefficient of variation is defined as:
i.e.,