
CBSE class 9 Maths Chapter 5 I’m Up and Down and Round and Round is very interesting chapter. Math can be nightmare for some students as it contains complex formula, diagram and involves critical thinking. But some students also enjoy solving complex math problem.
In I’m Up and Down and Round and Round Notes students will learn about the circles and their parts, symmetry, equal chords, angles, arcs, and cyclic quadrilaterals.. These concepts will strength the concept and prepare students for upcoming exam.
I’m Up and Down, and Round and Round Notes
Important Topics
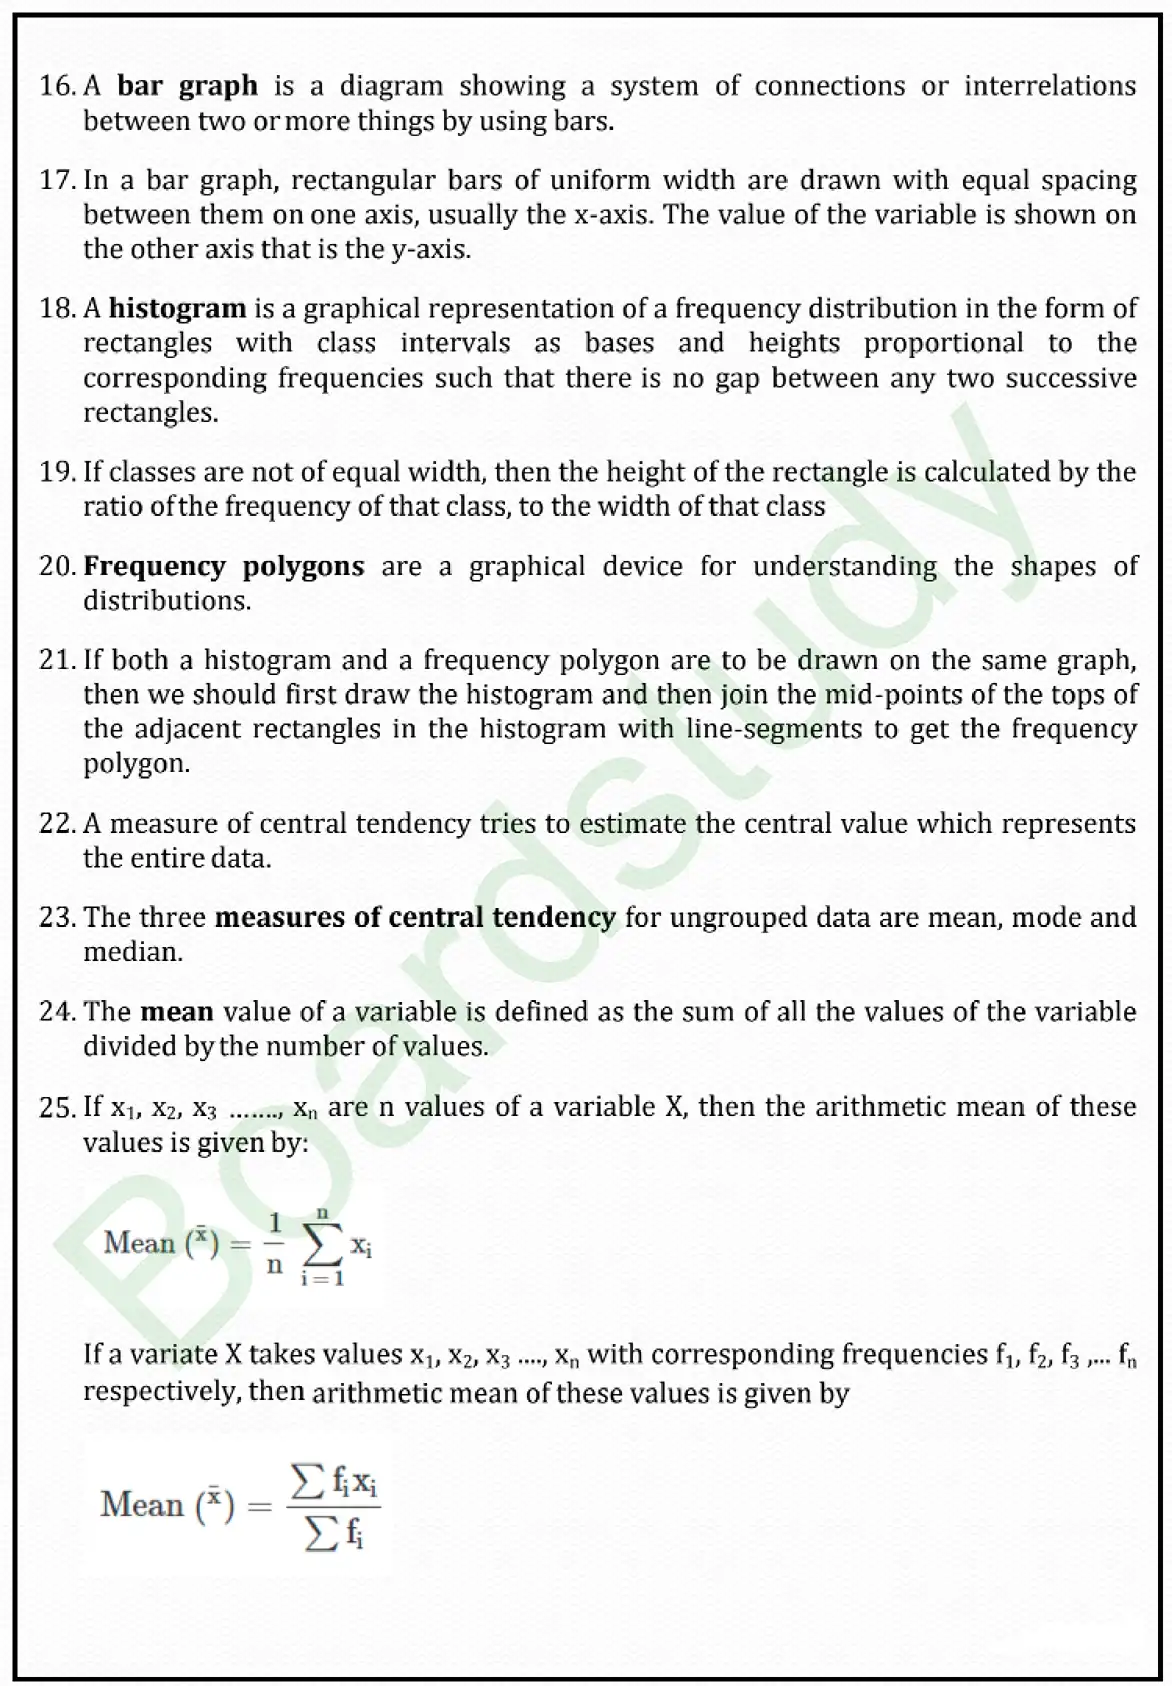
The mean value of a variable is defined as the sum of all the values of the variable divided by the number of values.
are n values of a variable X, then the arithmetic mean of these values is given by:
If a variate X takes values
with corresponding frequencies
respectively, then arithmetic mean of these values is given by
A bar graph is a diagram showing a system of connections or interrelations between two or more things by using bars.
In a bar graph, rectangular bars of uniform width are drawn with equal spacing between them on one axis, usually the x-axis. The value of the variable is shown on the other axis that is the y-axis.
A histogram is a graphical representation of a frequency distribution in the form of rectangles with class intervals as bases and heights proportional to the corresponding frequencies such that there is no gap between any two successive rectangles.
If classes are not of equal width, then the height of the rectangle is calculated by the ratio of the frequency of that class, to the width of that class
Frequency polygons are a graphical device for understanding the shapes of distributions.
If both a histogram and a frequency polygon are to be drawn on the same graph, then we should first draw the histogram and then join the mid-points of the tops of the adjacent rectangles in the histogram with line-segments to get the frequency polygon.
A measure of central tendency tries to estimate the central value which represents the entire data.
The three measures of central tendency for ungrouped data are mean, mode and median.