
Mathematics can be both fantastic and challenging at the same time. Specially in class 10 when students have to give board paper. So our NCERT class 10 Mathematics Chapter 3 Pair of Linear Equations in Two Variables notes will provide conceptual clarity to the students. It will work like a bridge for students between class room theory lecture and solving exercise at home.
These Class 10 Chapter 3 Pair of Linear Equations in Two Variables Notes is a masterstroke for students who want to pursue a career in science, like becoming an engineer, scientist etc. Most of the concept given in class 11 maths have already been introduced in class 10 maths. So these notes are also the foundation of class 11 math.
NCERT Class 10 Maths Chapter 3 Pair of Linear Equations in Two Variables Notes
Chapter 2: Polynomials Notes
Chapter 4: Quadratic Equations Notes
Below we have also given most important topics of NCERT Class 10 Mathematics chapter 3 Pair of Linear Equations in Two Variables Notes. Students should revise these notes regularly to remember the chapter properly.
Important Topics of Pair of Linear Equations in Two Variables
ting a Straight Line
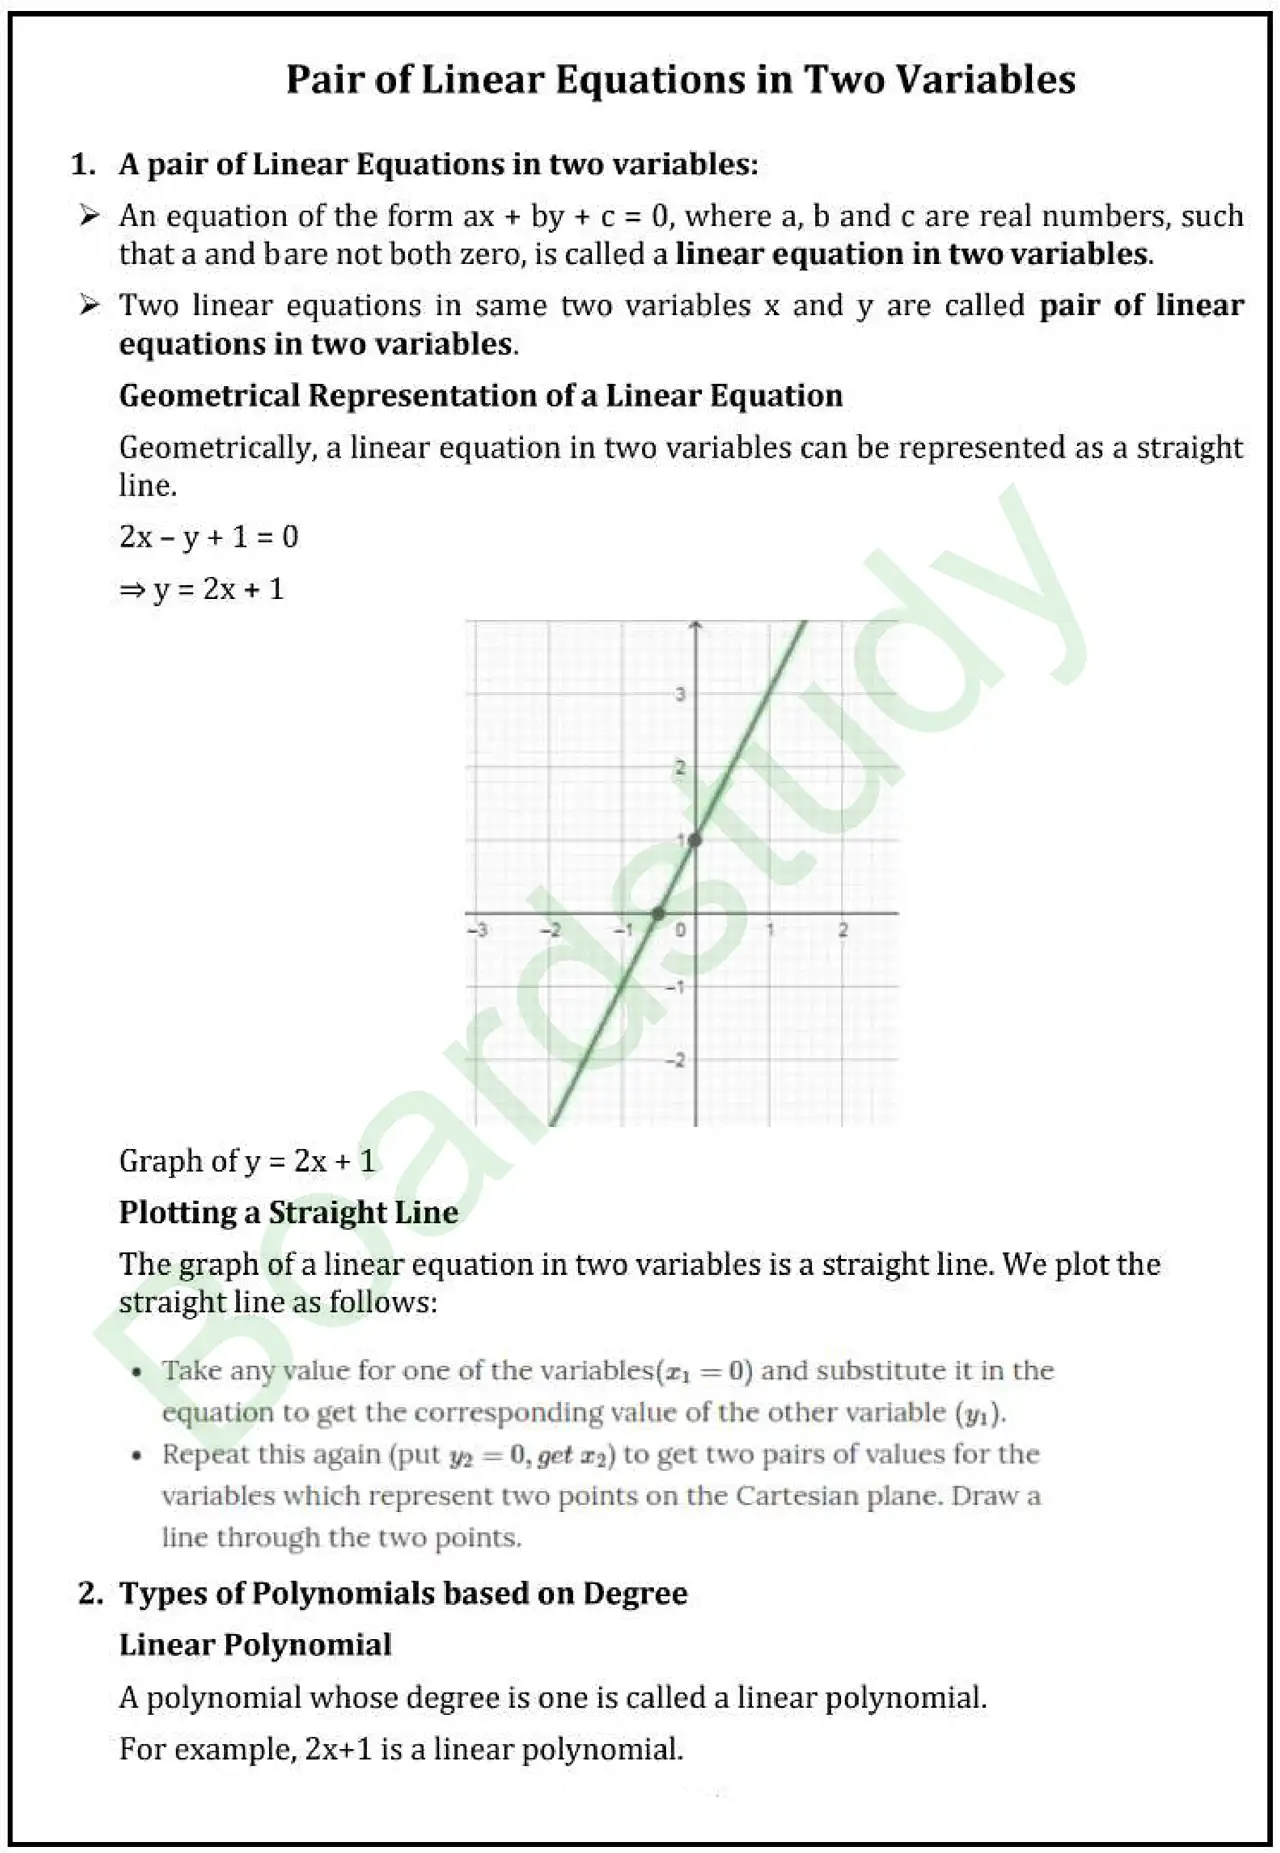
The graph of a linear equation in two variables is a straight line. The steps to plot a straight line are:
- Choose an initial value for one variable, such as setting x1 = 0, and solve the equation to determine the corresponding value of the second variable (y1).
- Repeat the process by selecting another value, such as setting y2 = 0, to calculate x2. This generates two ordered pairs of values representing distinct coordinates on the Cartesian plane. Connect these two points with a straight line.
Types of Polynomials Based on Degree
- Linear Polynomial: A polynomial with a degree of 1.
- Example: 2x + 1
- Quadratic Polynomial: A polynomial with a degree of 2.
- Example: 3x^2 + 8x + 5
- Cubic Polynomial: A polynomial with a degree of 3.
- Example: 2x^3 + 5x^2 + 9x + 15
Graph of the Polynomial
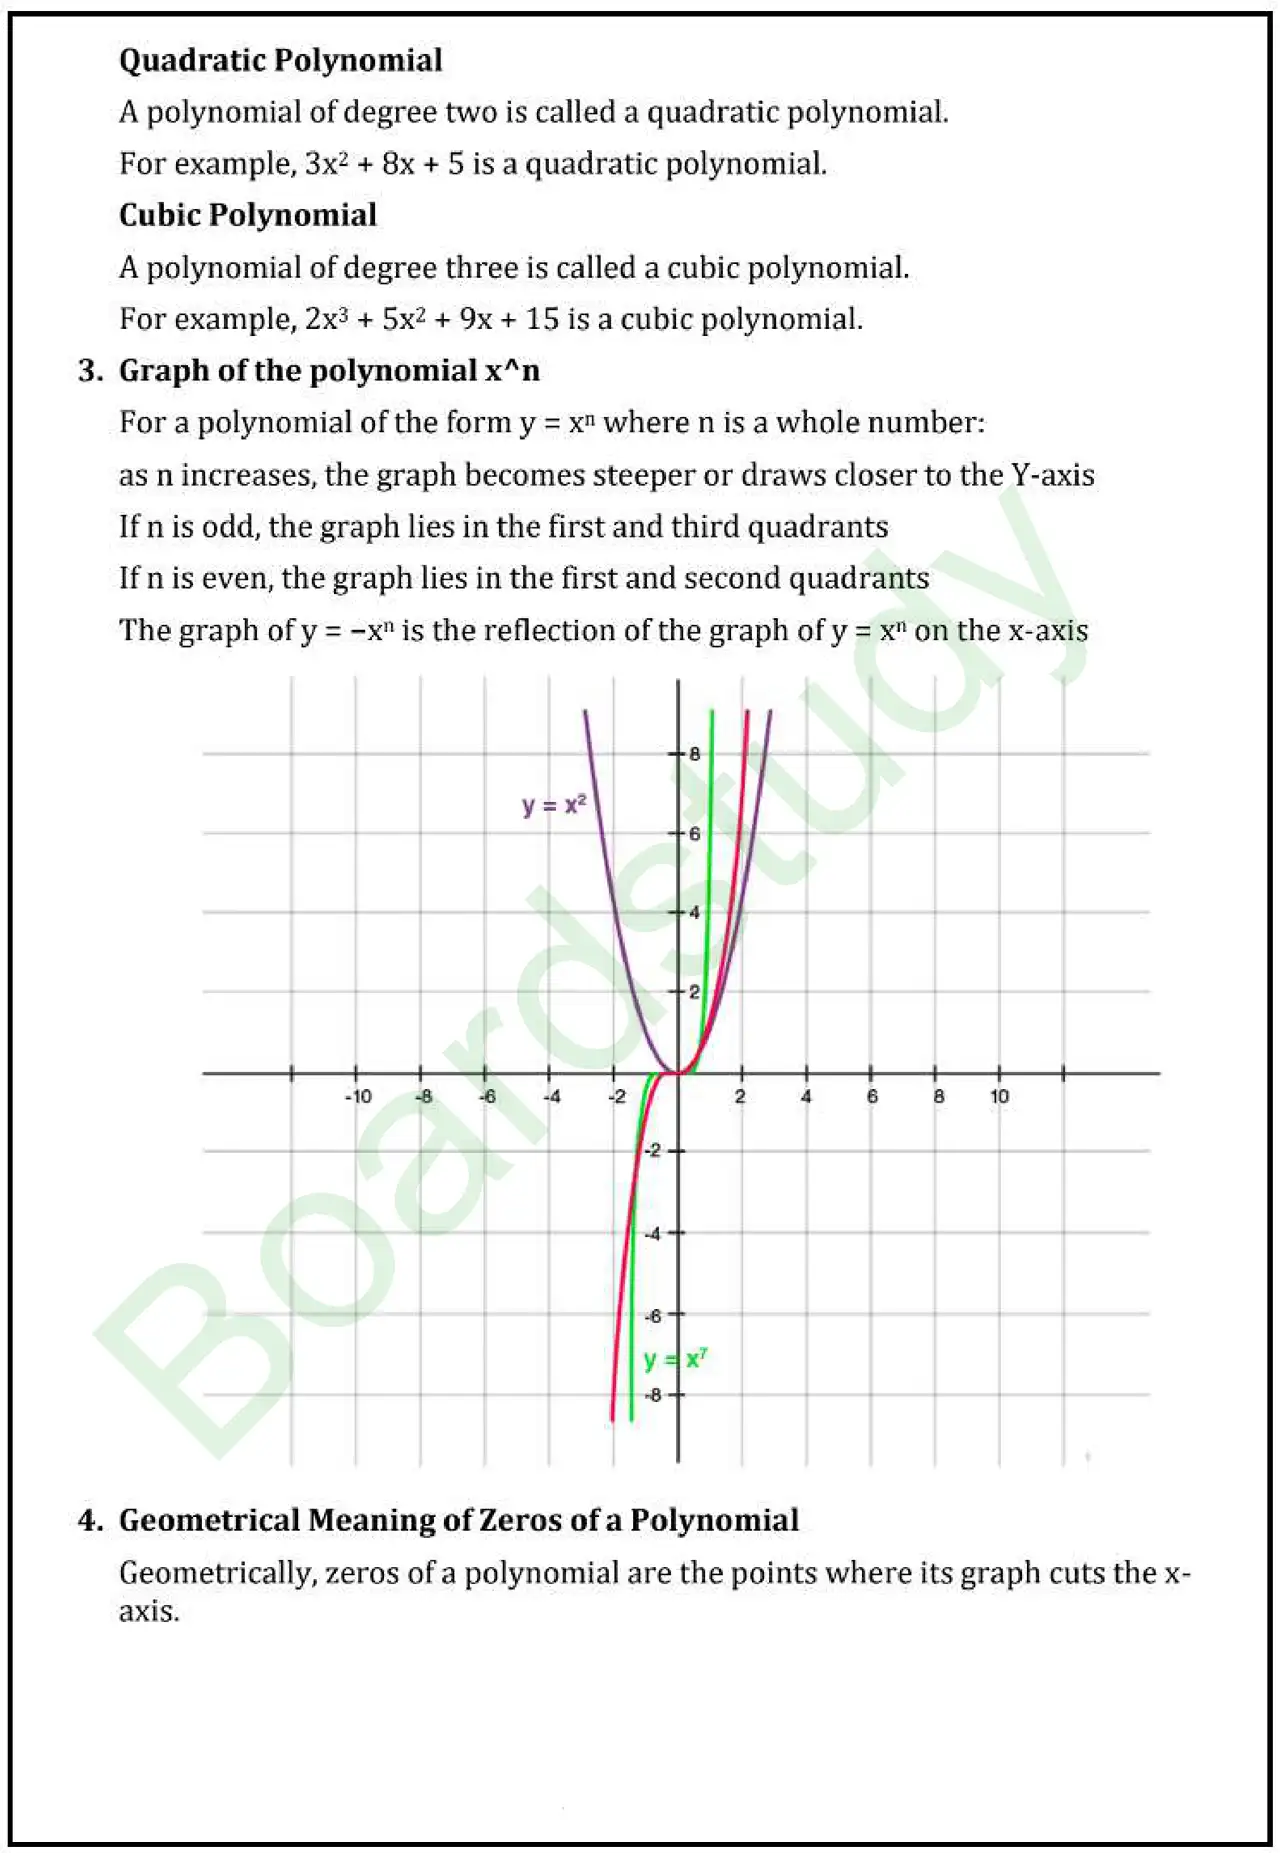
For a polynomial given by y = x^n, where n is a whole number:
- As the exponent n increases, the curve grows steeper and shifts closer to the Y-axis.
- When n is an odd number, the graph resides in the first and third quadrants.
- When n is an even number, the graph resides in the first and second quadrants.
- The graph of y = -x^n represents a reflection of the graph of y = x^n across the x-axis.